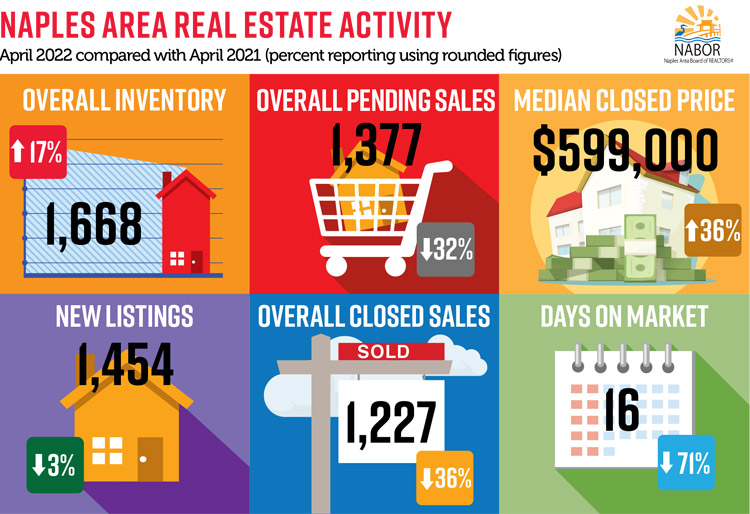
Inventory has been rising since December. By the end of May, Naples area inventory nearly doubled since the same time a year ago. And as one Broker observed, “If the 889 homes that had price reductions in May are added to this inventory mix, we’re in good shape heading into summer. Price reductions are basically like new listings because the home’s new price point becomes a new opportunity to a larger pool of buyers.” Though many of the brokers reviewing the report warn against comparing activity today to activity in the last two years. “If you look at the percentage of home sales since January compared to last year, it appears we are doing poorly [-32.5%],” said the CEO, of a Naples Brokerage. “But 2021 was not a typical year for home sales in Naples. We had record level sales last year. However, we also can’t compare activity today to 2020 because during the first half of that year, the country was under pandemic restrictions which caused sales to suffer.” As such, brokers prefer to compare this year’s activity to activity in 2019 as it was a balanced year with 7.3 months supply of inventory. “A healthy market for us is six to 12 months of inventory,” said one Broker Associate. Looking at closed sales, there was a 24.5 percent decrease in May to 1,249 closed sales from 1,654 closed sales in May 2021. However, using 2019’s balanced market activity as a comparison, closed sales increased 7 percent month/month and 18 percent year to date/year to date. Demand remains strong despite having three times fewer options in inventory compared to 2019 levels. Today, we have 1.9 months supply of inventory. Not surprisingly, low supply and high demand are driving price increases in Naples and across the nation. Macro factors are now impacting the pace of sales, but the fundamentals suggest values will be insulated. In fact, home prices have historically outpaced the rate of inflation. And while new construction is adding to the inventory, it’s not at a rate that will triple the inventory anytime soon. The overall median closed price increased 40.3 percent in May to $608,000 from $433,500 in May 2021. Median closed price increases today may be somewhat misleading. If looking at closed sales by price range, the $300,000 and below market is down 56 percent. That’s because we have few homes in inventory within this price category anymore. Therefore, a huge drop in the number of sales in the lower price categories means the calculation used to determine today’s median closed price reflects sales in those price categories where there is more inventory. Since January, we’ve seen a 21.9 percent increase in the number of homes sold in the $500,000 to $1 million price category. The NABOR® May 2022 Market Report provides comparisons of single-family home and condominium sales (via the Southwest Florida MLS), price ranges, and geographic segmentation and includes an overall market summary. NABOR® sales statistics are presented in chart format, including these overall (single-family and condominium) findings for 2022: |